Home
SERVICES
Team
Galleries
CONTACT
Search for:
Facebook
Twitter
LinkedIN
Wechat
Youku
Infographics
Home
·
Galleries
·
Infographics
Press
Infrastructure
Wood
Beautiful Africa
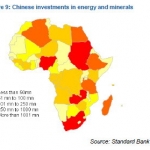
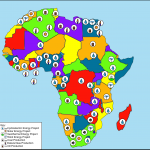
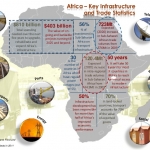
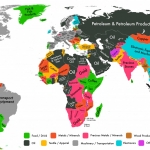
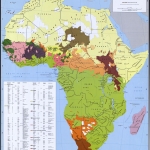
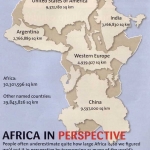
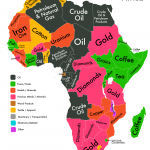
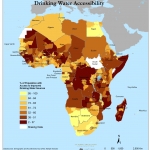
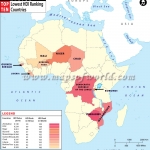
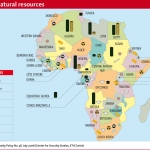
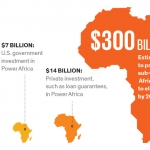
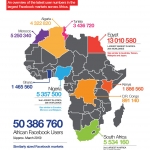
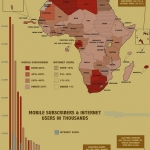
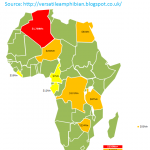
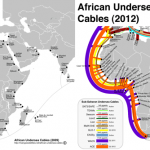
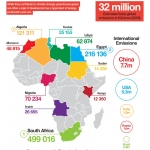
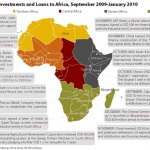
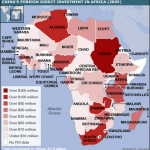
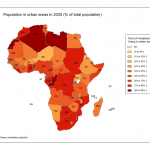
Information graphics or infographics are graphic visual representations of information, data or knowledge intended to present complex information quickly and clearly. These visual diagrams focus on Africa economy.
China-Africa-trade-2012
china-direct-invest-africa
Energy_Resources_and_Projects_in_Continental_Africa,_snapshot_2012
facilitating-trade-across-africa-with-ports-infrastructure-development
urban-population2030
world-commodities-map
Africa_ethnic_groups_1996
africa_in_perspective_map
africa-commodities-map
africa-Drinking_Water_Accessibility
africa-flags
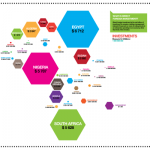
africa-foreign-investment
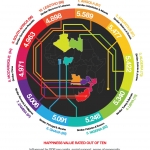
africa-happiest-countries-2013
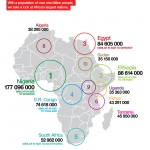
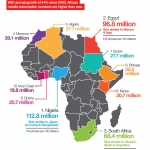
africa-largest-populations
africa-lowest-hdi-ranking-countries
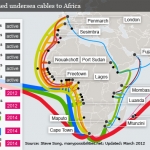
african_undersea_cables_map
africa-natural-resources
african-CO2-emissions
africa-need-electricity
african-facebook-users-2013
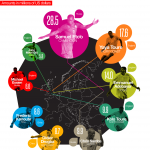
african-footballers-earnings
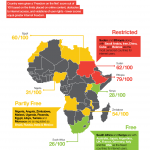
african-internet-censorship
african-mobile-subscription-2013
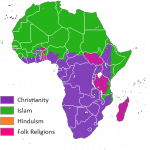
africa-Religion_distribution
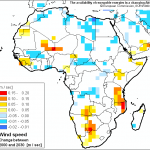
africa-renewable-energy
africa-rising
africa-telecom
Africa-telecom-Investment Map-2012
africa-undersea-cables
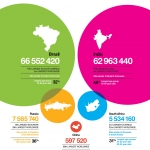
brics-facebook-users
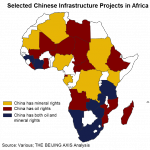
China Infrastructure Projects
China-Africa 5-Jan2010
China-Africa-Jan2010-1
world-commodities-map
african_undersea_cables_map
african-CO2-emissions
african-facebook-users-2013
african-footballers-earnings
african-internet-censorship
african-mobile-subscription-2013
africa-undersea-cables
brics-facebook-users
China Infrastructure Projects
China-Africa 5-Jan2010
China-Africa-Jan2010-1
China-Africa-trade-2012
Energy_Resources_and_Projects_in_Continental_Africa,_snapshot_2012
facilitating-trade-across-africa-with-ports-infrastructure-development
china-direct-invest-africa
urban-population2030
Copyright 2014-2018 Great Wall Investment - Powered by
NOVATIS
Home
SERVICES
Team
SITE MAP
CONTACT